


Learn how to use Telegraf, InfluxDB, and Grafana to monitor FTP transfer logs (xferlog). This guide walks you through the installation, configuration, and visualization process step by step. FTP servers are still the primary method for file transfers in many organizations...
FTP servers are still heavily used for file transfers in many organizations. However, tracking details like how long these transfers take, which IP addresses they originate from, file sizes, and failed transfers can often be overlooked.
In this article, I will explain step by step how you can collect FTP transfer logs (xferlog) using the Telegraf, InfluxDB and Grafana trio, store them in the database and visualize them with Grafana.
Why Monitor FTP Transfers?
Monitoring FTP logs isn't just for curiosity's sake; it's also critical for system security and performance. Here are some reasons:
- Keeping track of large file transfers
- Detecting failed transfers and unusual activity
- Monitor and improve server performance
- Meeting reporting and auditing needs
1.) Introduction
Before starting the installation, it is recommended to stop the firewall service and disable SELinux.
A classic FTP logging example:
Mon Sep 15 15:40:20 2025 15 10.10.10.11 500 /tmp/test.kopya b _ i r ftpuser ftp 0 * c- Sat Sep 12 01:01:18 2025
- Meaning: The date and time the transaction occurred.
- Description: This indicates that the transfer occurred on September 15, 2025, at 15:40:20 (local time).
- 15
- Meaning: Transfer time (in seconds).
- Description: File transfer took 15 seconds.
- 10.10.10.11
- Meaning: Client IP address.
- Description: The IP address of the client performing the transfer is 10.10.10.11.
- 500
- Meaning: Transferred file size (in bytes).
- Description: The transferred file (test_hosts.txt) is 500 bytes in size.
- /tmp/test.copy
- Meaning: The full path of the transferred file.
- Description: The file is named test_hosts.txt located in the /tmp/test.copy directory on the server.
- b
- Meaning: Transfer type.
- Explanation: b represents a binary transfer. Another possibility is a (ASCII). In this case, the file was transferred in binary mode.
- _
- Meaning: Compression method.
- Explanation: The _ indicates that no compression is used during the transfer. Some FTP servers may use compression, in which case a different value (for example, Z or T) may appear.
- i
- Meaning: Transfer direction.
- Explanation: i indicates an incoming transfer, meaning the file is being uploaded from the client to the server. If it were o, it would indicate outgoing, meaning downloading.
- r
- Meaning: User type.
- Explanation: r represents the remote user. This indicates that the transferring user is connecting through an FTP client. Another value (for example, l) can be used for local users.
- ftpuser
- Meaning: The username that performed the transfer.
- Description: The FTP client is logged on with the user account ftpuser.
- ftp
- Meaning: Service name.
- Description: Indicates that the transfer occurred via the FTP protocol. Other protocols (e.g., SFTP) may have a different value.
- 0
- Meaning: Authentication method.
- Description: 0 indicates that there is no anonymous session and that you are logged in with a real user account. 1 is used for anonymous FTP.
- *
- Meaning: Additional information for authentication.
- Meaning: Additional information for authentication. Description: * usually indicates no additional information or that sensitive information such as a password is hidden.
- c
- Meaning: The status of the transfer completion.
- Explanation: c means complete, meaning the file transfer was completed successfully. If it were i, it would mean incomplete.
2.) Downloading and Installing the Required Files
Files required to install Telegraf, Influxdb and Grafana on your Linux-based server:
wget https://repos.influxdata.com/rhel/7/x86_64/stable/influxdb2-2.7.12-1.x86_64.rpm

wget https://repos.influxdata.com/rhel/7/x86_64/stable/telegraf-1.36.1-1.x86_64.rpm

wget https://dl.grafana.com/grafana-enterprise/release/12.1.1/grafana-enterprise_12.1.1_16903967602_linux_amd64.rpm

wget https://dl.influxdata.com/influxdb/releases/influxdb2-client-2.7.5-linux-amd64.tar.gzInstalling the necessary rpm files and starting their services:
rpm -ivh influxdb2-2.7.12-1.x86_64.rpm
rpm -ivh telegraf-1.36.1-1.x86_64.rpm
rpm -ivh grafana-enterprise_12.1.1_16903967602_linux_amd64.rpm
systemctl start grafana-server.service
systemctl start influxdb.service
systemctl start telegraf.servicesystemctl enable grafana-server.service
systemctl enable influxdb.service
systemctl enable telegraf.serviceInflux CLI Installation:
tar -xzvf influxdb2-client-2.7.5-linux-amd64.tar.gzmv influx /usr/bin/influx
chmod +x /usr/bin/influxinflux version
Influx CLI dev (git: a79a2a1b825867421d320428538f76a4c90aa34c) build_date: 2024-04-16T14:34:32Z3.) InfluxDB Setup
By default, the InfluxDB service runs with localhost:8086 host and port information.
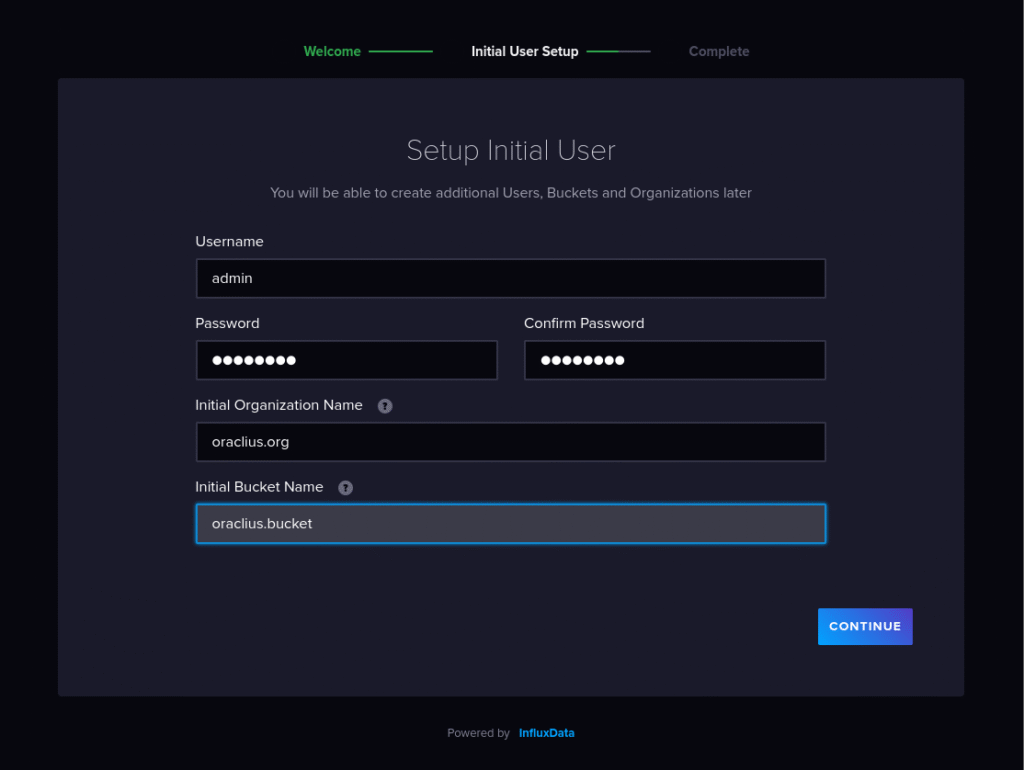
Let's go to localhost:8086 or :8086 from the browser and make the necessary settings:
Username => admin
Password => 12345678
Initial Organization Name => oraclius.org
Initial Bucket Name => oraclius.bucket
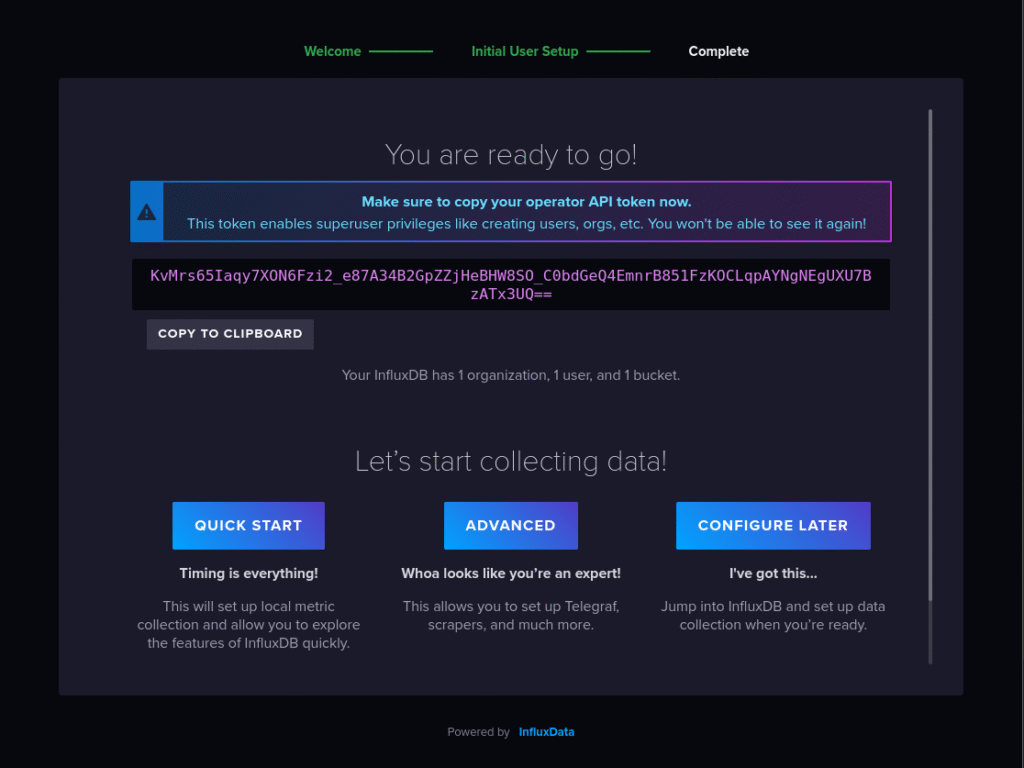
admin's Token
KvMrs65Iaqy7XON6Fzi2_e87A34B2GpZZjHeBHW8SO_C0bdGeQ4EmnrB851FzKOCLqpAYNgNEgUXU7BzATx3UQ==
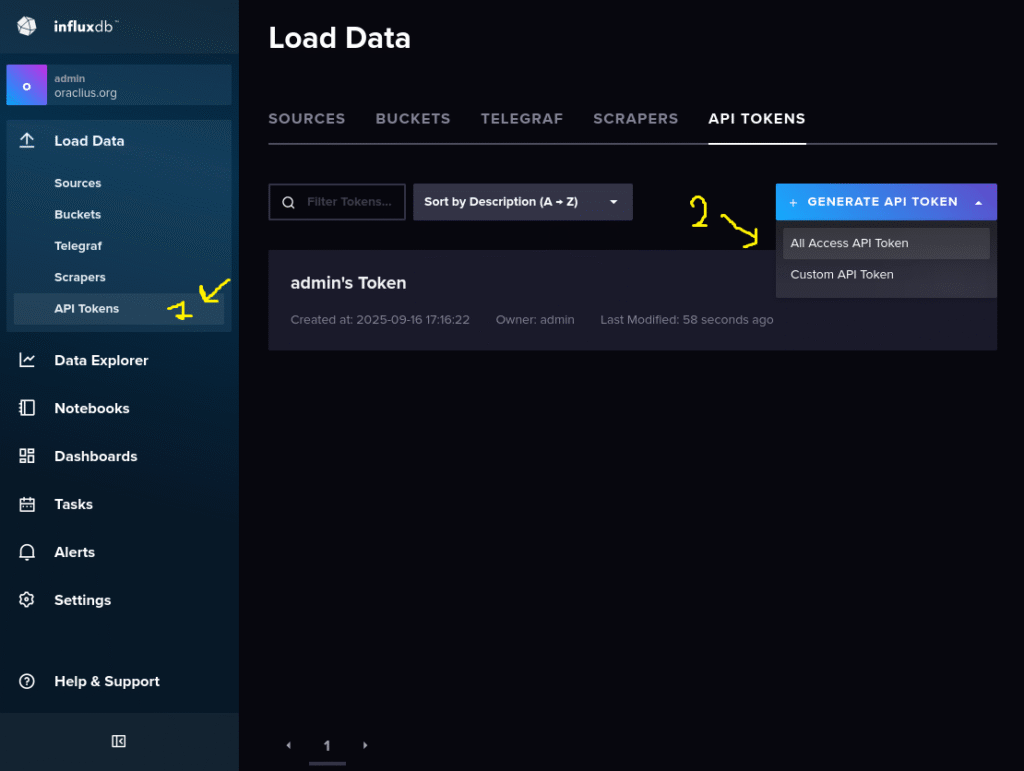
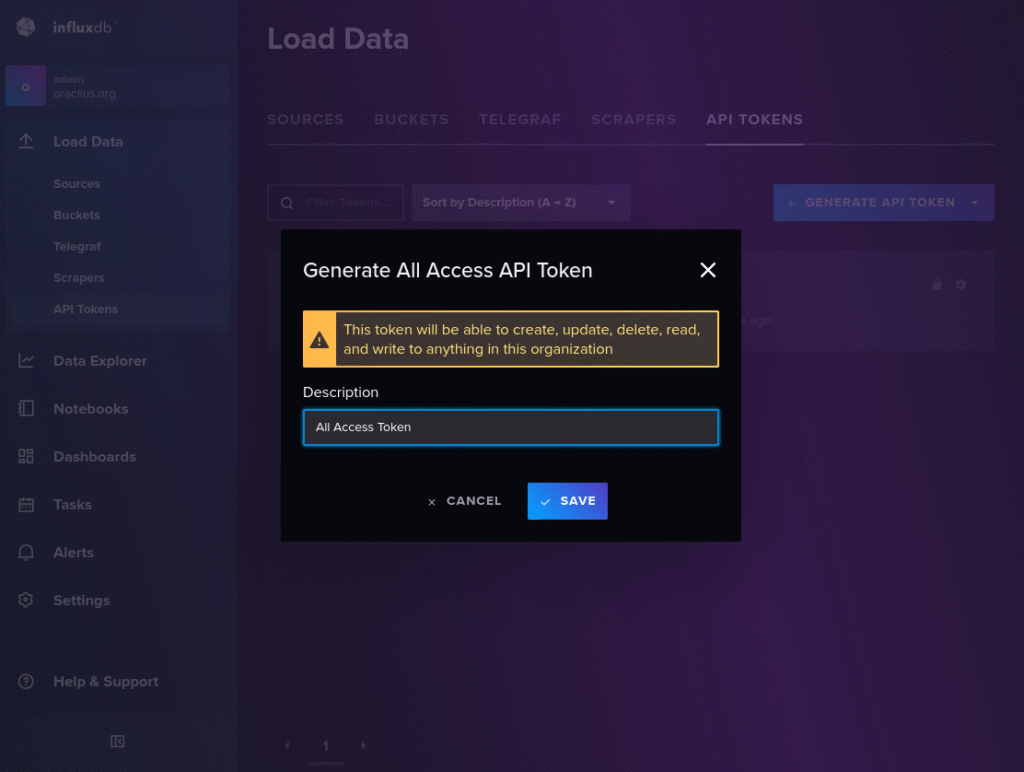
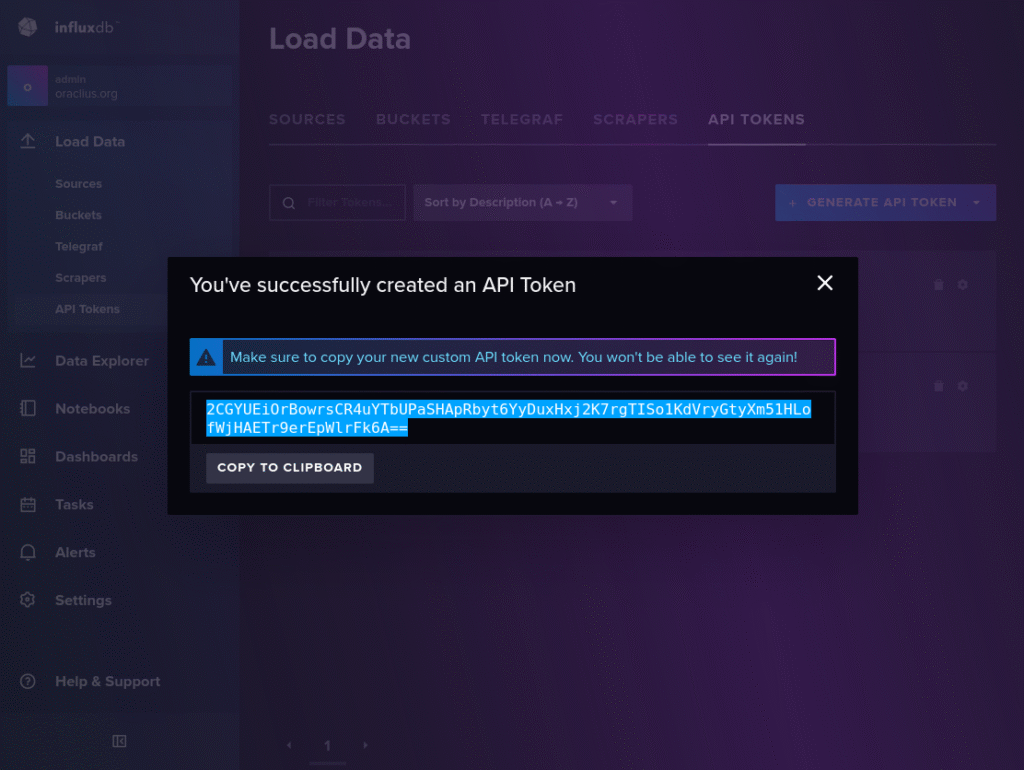
All Access API Token
2CGYUEiOrBowrsCR4uYTbUPaSHApRbyt6YyDuxHxj2K7rgTISo1KdVryGtyXm51HLofWjHAETr9erEpWlrFk6A==
4.) Editing the Telegrac Conf File
Using some of the information we obtained in the InfluxDB Setup step, we will ensure that the metrics we collect with Telegraf are transferred to InfluxDB:
vi /etc/telegraf/telegraf.conf
[agent]
  interval = "10s"
  round_interval = true
  metric_batch_size = 1000
  metric_buffer_limit = 10000
  collection_jitter = "0s"
  flush_interval = "10s"
  flush_jitter = "0s"
  precision = "0s"

[[outputs.influxdb_v2]]
  urls = ["http://10.10.10.11:8086"]
  token = "2CGYUEiOrBowrsCR4uYTbUPaSHApRbyt6YyDuxHxj2K7rgTISo1KdVryGtyXm51HLofWjHAETr9erEpWlrFk6A=="
  organization = "oraclius.org"
  bucket = "oraclius.bucket"

[[inputs.tail]]
  files = ["/var/log/xferlog"]
  from_beginning = false
  name_override = "ftp_transfers"
  data_format = "grok"
  grok_patterns = [
  '%{DAY:day} %{MONTH:month} %{MONTHDAY:daynum} %{TIME:log_time} %{YEAR:year} %{NUMBER:transfer_number:int} %{IP:client_ip} %{NUMBER:bytes:int} %{DATA:file_path} %{WORD:transfer_type} %{WORD:compression_method} %{WORD:transfer_direction} %{WORD:user_type} %{WORD:ftp_user} %{WORD:service_name} %{NUMBER:auth_method:int} %{DATA:auth_method_extra} %{WORD:status}'
]
  initial_read_offset = "end"

[[processors.starlark]]
  namepass = ["ftp_transfers"]
  source = '''
def apply(metric):
    months = {
        "Jan":"01","Feb":"02","Mar":"03","Apr":"04","May":"05","Jun":"06",
        "Jul":"07","Aug":"08","Sep":"09","Oct":"10","Nov":"11","Dec":"12"
    }

    month = metric.fields.get("month")
    daynum = str(metric.fields.get("daynum"))
    year = str(metric.fields.get("year"))
    log_time = metric.fields.get("log_time")

    if month != None and daynum != None and year != None and log_time != None:
        mon = months.get(month, "01")
        if len(daynum) == 1:
            daynum = "0" + daynum
        formatted = daynum + "/" + mon + "/" + year + " " + log_time
        metric.fields["ftp_date"] = formatted

    return metric
'''
Since we changed the Telegraf conf file, we need to restart the Telegraf service.
systemctl restart telegraf.service5.) Generating FTP Logs for Testing Purposes
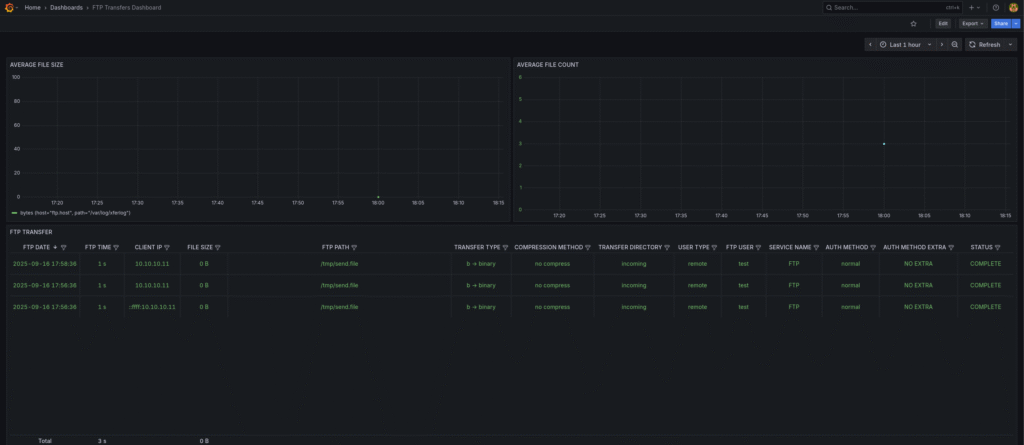
Let's test whether Telegraf reads the FTP log file (xferlog) correctly:
touch /tmp/ftp.file

[root@ftp log]# touch /tmp/ftp.file
[root@ftp log]# ftp 10.10.10.11
Connected to 10.10.10.11 (10.10.10.11).
220 (vsFTPd 3.0.2)
Name (10.10.10.11:root): test
331 Please specify the password.
Password:
230 Login successful.
Remote system type is UNIX.
Using binary mode to transfer files.
ftp> put /tmp/ftp.file /tmp/send.file
local: /tmp/ftp.file remote: /tmp/send.file
227 Entering Passive Mode (10,10,10,11,69,196).
150 Ok to send data.
226 Transfer complete.
ftp> bye
221 Goodbye.
[root@ftp log]# cat xferlog
Tue Sep 16 17:56:36 2025 1 10.10.10.11 0 /tmp/send.file b _ i r test ftp 0 * c
We can run Telegraf in debug mode and see the errors:
[root@ftp Downloads]# telegraf --config /etc/telegraf/telegraf.conf --debug

# telegraf --config /etc/telegraf/telegraf.conf --debug
2025-09-16T14:58:43Z I! Loading config: /etc/telegraf/telegraf.conf
2025-09-16T14:58:43Z I! Starting Telegraf 1.36.1 brought to you by InfluxData the makers of InfluxDB
2025-09-16T14:58:43Z I! Available plugins: 239 inputs, 9 aggregators, 35 processors, 26 parsers, 65 outputs, 6 secret-stores
2025-09-16T14:58:43Z I! Loaded inputs: tail
2025-09-16T14:58:43Z I! Loaded aggregators:
2025-09-16T14:58:43Z I! Loaded processors: starlark
2025-09-16T14:58:43Z I! Loaded secretstores:
2025-09-16T14:58:43Z I! Loaded outputs: influxdb_v2
2025-09-16T14:58:43Z I! Tags enabled: host=ftp.host
2025-09-16T14:58:43Z I! [agent] Config: Interval:10s, Quiet:false, Hostname:"ftp.host", Flush Interval:10s
2025-09-16T14:58:43Z W! [agent] The default value of 'skip_processors_after_aggregators' will change to 'true' with Telegraf v1.40.0! If you need the current default behavior, please explicitly set the option to 'false'!
2025-09-16T14:58:43Z D! [agent] Initializing plugins
2025-09-16T14:58:43Z D! [agent] Connecting outputs
2025-09-16T14:58:43Z D! [agent] Attempting connection to [outputs.influxdb_v2]
2025-09-16T14:58:43Z D! [agent] Successfully connected to outputs.influxdb_v2
2025-09-16T14:58:43Z D! [agent] Starting service inputs
2025-09-16T14:58:43Z D! [inputs.tail] Tail added for "/var/log/xferlog"
2025-09-16T14:58:53Z D! [outputs.influxdb_v2] Wrote batch of 1 metrics in 5.647823ms
2025-09-16T14:58:53Z D! [outputs.influxdb_v2] Buffer fullness: 0 / 10000 metrics
In debug mode, it found the line written to xferlog and managed to process it.
6.) Creating a Grafana Dashboard
Grafana runs on port 3000 by default. Let's access localhost:300 or :3000 from the browser and make the necessary settings:
The Username and Password asked for when you first log in are admin/admin by default.
Let's create a new Data Connection for the InfluxDB connection from the right menu:
Connections => Add new connection => InfluxDB => Add new data source
InfluxDB Connection Settings:
- Query Language => Flux
- HTTP URL => http://10.10.10.11:8086
- Organization => oraclius.org
- Token => 2CGYUEiOrBowrsCR4uYTbUPaSHApRbyt6YyDuxHxj2K7rgTISo1KdVryGtyXm51HLofWjHAETr9erEpWlrFk6A==
- Default Bucket => oraclius.bucket
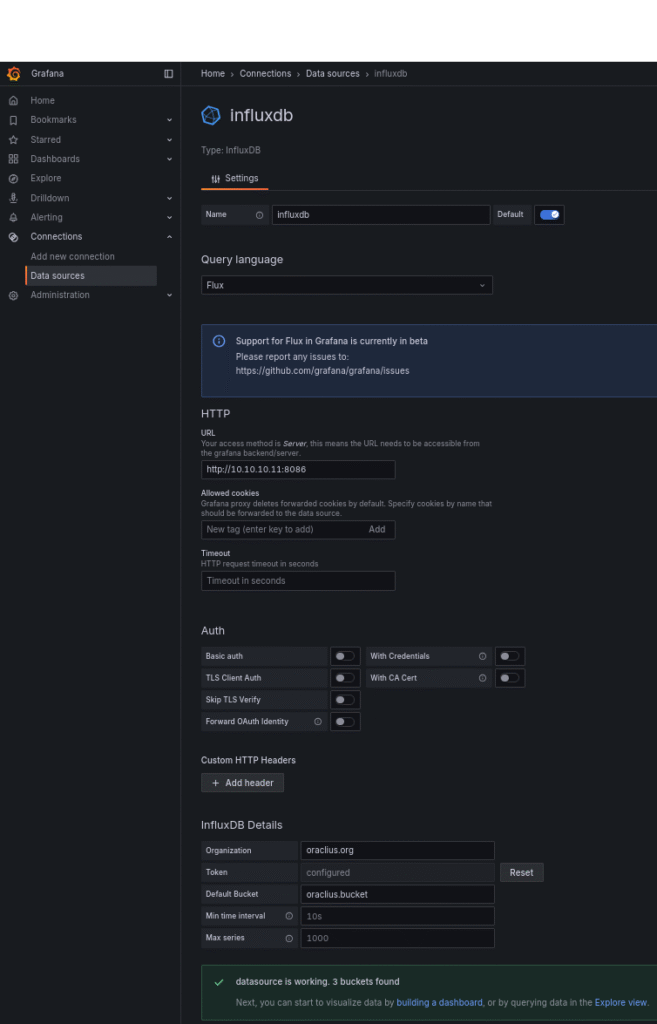
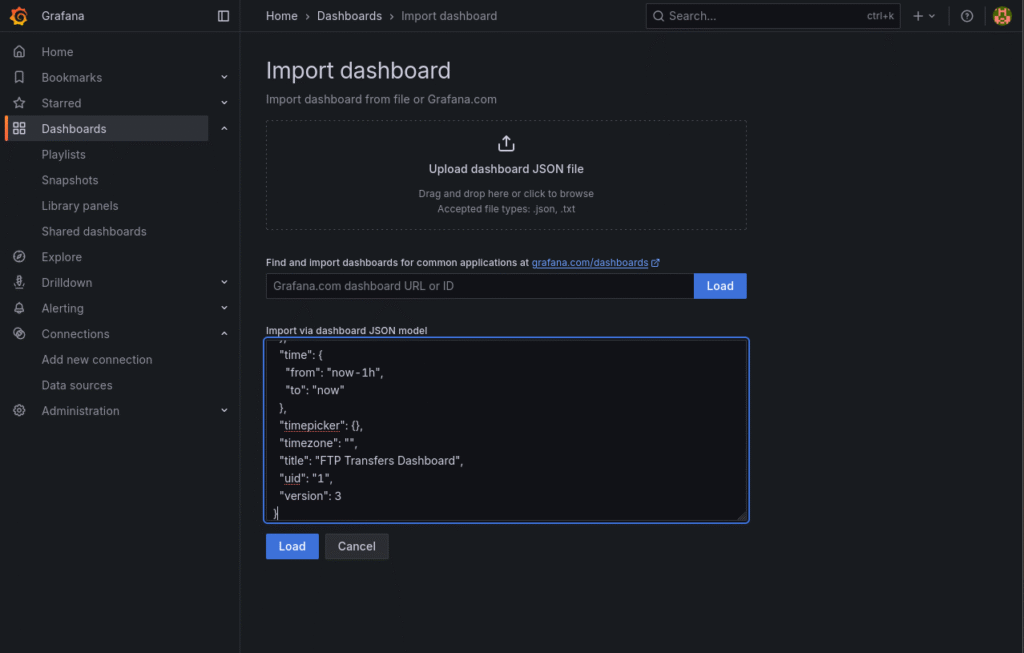
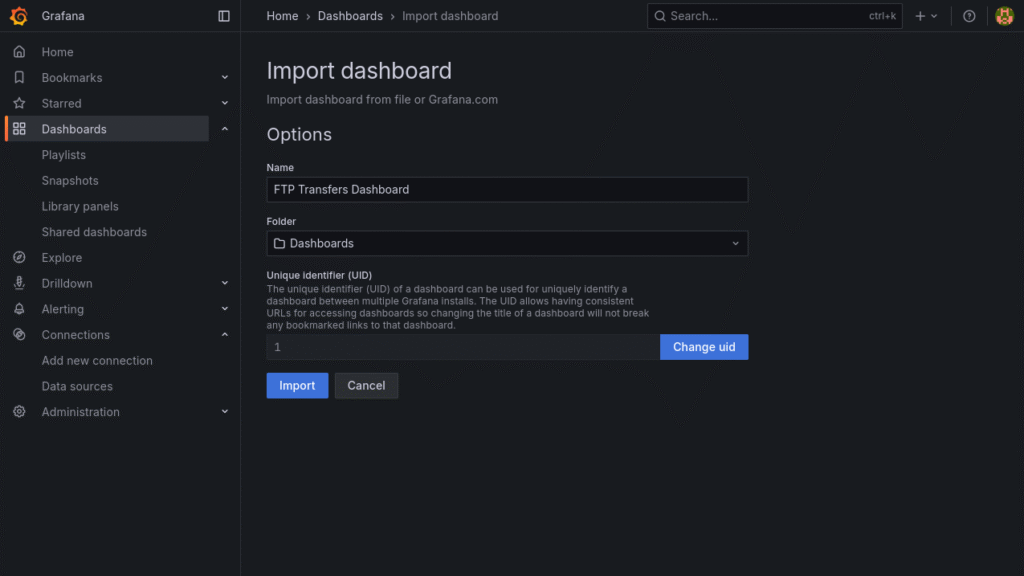
A successful connection to InfluxDB has been made with Grafana. Now let's import a ready-made Dashboard and analyze the ftp logs:
Grafan => Dashboard => New => Import Dashboard
{
"annotations": {
"list": [
{
"builtIn": 1,
"datasource": {
"type": "grafana",
"uid": "-- Grafana --"
},
"enable": true,
"hide": true,
"iconColor": "rgba(0, 211, 255, 1)",
"name": "Annotations & Alerts",
"type": "dashboard"
}
]
},
"description": "YEATAY\nhttps://oraclius.com.tr/",
"editable": true,
"fiscalYearStartMonth": 0,
"graphTooltip": 0,
"id": 2,
"links": [],
"panels": [
{
"datasource": {
"type": "influxdb",
"uid": "eey9efurcmvb4c"
},
"fieldConfig": {
"defaults": {
"color": {
"mode": "palette-classic"
},
"custom": {
"axisBorderShow": false,
"axisCenteredZero": false,
"axisColorMode": "text",
"axisLabel": "",
"axisPlacement": "auto",
"barAlignment": 0,
"barWidthFactor": 0.6,
"drawStyle": "line",
"fillOpacity": 0,
"gradientMode": "none",
"hideFrom": {
"legend": false,
"tooltip": false,
"viz": false
},
"insertNulls": false,
"lineInterpolation": "smooth",
"lineWidth": 1,
"pointSize": 5,
"scaleDistribution": {
"type": "linear"
},
"showPoints": "auto",
"spanNulls": false,
"stacking": {
"group": "A",
"mode": "none"
},
"thresholdsStyle": {
"mode": "off"
}
},
"mappings": [],
"thresholds": {
"mode": "absolute",
"steps": [
{
"color": "green",
"value": 0
},
{
"color": "red",
"value": 80
}
]
}
},
"overrides": [
{
"matcher": {
"id": "byName",
"options": "bytes {host=\"ftp.host\", path=\"/var/log/xferlog\"}"
},
"properties": [
{
"id": "unit",
"value": "bytes"
}
]
}
]
},
"gridPos": {
"h": 11,
"w": 12,
"x": 0,
"y": 0
},
"id": 5,
"options": {
"legend": {
"calcs": [],
"displayMode": "list",
"placement": "bottom",
"showLegend": false
},
"tooltip": {
"hideZeros": false,
"mode": "single",
"sort": "none"
}
},
"pluginVersion": "12.1.1",
"targets": [
{
"query": "from(bucket: \"oraclius.bucket\")\n |> range(start: v.timeRangeStart, stop: v.timeRangeStop)\n |> filter(fn: (r) => r[\"_measurement\"] == \"ftp_transfers\")\n |> filter(fn: (r) => r[\"_field\"] == \"bytes\")\n |> aggregateWindow(every: 5m, fn: sum, createEmpty: false)\n |> yield(name: \"total_bytes_5m\")\n",
"refId": "A"
}
],
"title": "AVERAGE FILE SIZE",
"transformations": [
{
"id": "organize",
"options": {
"excludeByName": {
"Time": false,
"bytes {host=\"grafana.ftp\", path=\"/var/log/xferlog\"}": false
},
"includeByName": {},
"indexByName": {},
"renameByName": {}
}
}
],
"type": "timeseries"
},
{
"datasource": {
"type": "influxdb",
"uid": "eey9efurcmvb4c"
},
"fieldConfig": {
"defaults": {
"color": {
"mode": "palette-classic"
},
"custom": {
"axisBorderShow": false,
"axisCenteredZero": false,
"axisColorMode": "series",
"axisLabel": "",
"axisPlacement": "auto",
"barAlignment": 0,
"barWidthFactor": 0.6,
"drawStyle": "line",
"fillOpacity": 0,
"gradientMode": "none",
"hideFrom": {
"legend": false,
"tooltip": false,
"viz": false
},
"insertNulls": false,
"lineInterpolation": "smooth",
"lineStyle": {
"fill": "solid"
},
"lineWidth": 1,
"pointSize": 5,
"scaleDistribution": {
"type": "linear"
},
"showPoints": "auto",
"spanNulls": false,
"stacking": {
"group": "A",
"mode": "none"
},
"thresholdsStyle": {
"mode": "off"
}
},
"mappings": [],
"thresholds": {
"mode": "absolute",
"steps": [
{
"color": "green",
"value": 0
},
{
"color": "red",
"value": 80
}
]
}
},
"overrides": []
},
"gridPos": {
"h": 11,
"w": 12,
"x": 12,
"y": 0
},
"id": 3,
"options": {
"legend": {
"calcs": [],
"displayMode": "list",
"placement": "bottom",
"showLegend": false
},
"tooltip": {
"hideZeros": false,
"mode": "single",
"sort": "none"
}
},
"pluginVersion": "12.1.1",
"targets": [
{
"query": "from(bucket: \"oraclius.bucket\")\n |> range(start: v.timeRangeStart, stop: v.timeRangeStop)\n |> filter(fn: (r) => r._measurement == \"ftp_transfers\")\n |> aggregateWindow(every: 5m, fn: count, createEmpty: false)\n |> yield(name: \"file_count\")\n",
"refId": "A"
}
],
"title": "AVERAGE FILE COUNT",
"type": "timeseries"
},
{
"datasource": {
"type": "influxdb",
"uid": "eey9efurcmvb4c"
},
"fieldConfig": {
"defaults": {
"color": {
"mode": "thresholds"
},
"custom": {
"align": "center",
"cellOptions": {
"type": "color-text",
"wrapText": true
},
"filterable": true,
"inspect": true
},
"fieldMinMax": false,
"mappings": [],
"thresholds": {
"mode": "absolute",
"steps": [
{
"color": "green",
"value": 0
}
]
}
},
"overrides": [
{
"matcher": {
"id": "byName",
"options": "FTP DATE"
},
"properties": [
{
"id": "custom.width",
"value": 175
}
]
},
{
"matcher": {
"id": "byName",
"options": "FTP TIME"
},
"properties": [
{
"id": "custom.width",
"value": 111
},
{
"id": "unit",
"value": "s"
},
{
"id": "thresholds",
"value": {
"mode": "absolute",
"steps": [
{
"color": "green",
"value": 0
},
{
"color": "orange",
"value": 100
},
{
"color": "red",
"value": 180
}
]
}
}
]
},
{
"matcher": {
"id": "byName",
"options": "CLIENT IP"
},
"properties": [
{
"id": "custom.width",
"value": 140
}
]
},
{
"matcher": {
"id": "byName",
"options": "FILE SIZE"
},
"properties": [
{
"id": "unit",
"value": "bytes"
},
{
"id": "custom.width",
"value": 119
}
]
},
{
"matcher": {
"id": "byName",
"options": "FTP PATH"
},
"properties": [
{
"id": "custom.width"
}
]
},
{
"matcher": {
"id": "byName",
"options": "TRANSFER TYPE"
},
"properties": [
{
"id": "mappings",
"value": [
{
"options": {
"a": {
"index": 1,
"text": "a → ASCII"
},
"b": {
"index": 0,
"text": "b → binary"
}
},
"type": "value"
}
]
},
{
"id": "custom.width",
"value": 150
}
]
},
{
"matcher": {
"id": "byName",
"options": "COMPRESSION METHOD"
},
"properties": [
{
"id": "mappings",
"value": [
{
"options": {
"T": {
"index": 2,
"text": "tar/stream"
},
"Z": {
"index": 1,
"text": "Zmodem"
},
"_": {
"index": 0,
"text": "no compress"
}
},
"type": "value"
}
]
},
{
"id": "custom.width",
"value": 207
}
]
},
{
"matcher": {
"id": "byName",
"options": "TRANSFER DIRECTORY"
},
"properties": [
{
"id": "mappings",
"value": [
{
"options": {
"i": {
"color": "green",
"index": 0,
"text": "incoming"
},
"o": {
"color": "blue",
"index": 1,
"text": "outgoing"
}
},
"type": "value"
}
]
},
{
"id": "custom.width",
"value": 200
}
]
},
{
"matcher": {
"id": "byName",
"options": "USER TYPE"
},
"properties": [
{
"id": "mappings",
"value": [
{
"options": {
"l": {
"color": "blue",
"index": 1,
"text": "local"
},
"r": {
"color": "green",
"index": 0,
"text": "remote"
}
},
"type": "value"
}
]
},
{
"id": "custom.width",
"value": 118
}
]
},
{
"matcher": {
"id": "byName",
"options": "FTP USER"
},
"properties": [
{
"id": "custom.width",
"value": 112
}
]
},
{
"matcher": {
"id": "byName",
"options": "SERVICE NAME"
},
"properties": [
{
"id": "mappings",
"value": [
{
"options": {
"ftp": {
"index": 0,
"text": "FTP"
},
"ftps": {
"index": 2,
"text": "FTPS"
},
"scp": {
"index": 3,
"text": "SCP"
},
"sftp": {
"index": 1,
"text": "SFTP"
},
"tftp": {
"index": 4,
"text": "TFTP"
}
},
"type": "value"
}
]
},
{
"id": "custom.width",
"value": 140
}
]
},
{
"matcher": {
"id": "byName",
"options": "AUTH METHOD"
},
"properties": [
{
"id": "mappings",
"value": [
{
"options": {
"0": {
"color": "green",
"index": 0,
"text": "normal"
},
"1": {
"color": "blue",
"index": 1,
"text": "anonymous"
}
},
"type": "value"
}
]
},
{
"id": "custom.width",
"value": 143
}
]
},
{
"matcher": {
"id": "byName",
"options": "AUTH METHOD EXTRA"
},
"properties": [
{
"id": "mappings",
"value": [
{
"options": {
"*": {
"index": 0,
"text": "NO EXTRA"
}
},
"type": "value"
}
]
},
{
"id": "custom.width",
"value": 196
}
]
},
{
"matcher": {
"id": "byName",
"options": "STATUS"
},
"properties": [
{
"id": "mappings",
"value": [
{
"options": {
"c": {
"color": "green",
"index": 0,
"text": "COMPLETE"
},
"i": {
"color": "red",
"index": 1,
"text": "INCOMPLETE"
}
},
"type": "value"
}
]
},
{
"id": "custom.width",
"value": 139
}
]
}
]
},
"gridPos": {
"h": 15,
"w": 24,
"x": 0,
"y": 11
},
"id": 1,
"options": {
"cellHeight": "md",
"footer": {
"countRows": false,
"enablePagination": false,
"fields": [
"transfer_number",
"bytes"
],
"reducer": [
"sum"
],
"show": true
},
"showHeader": true,
"sortBy": [
{
"desc": true,
"displayName": "FTP DATE"
}
]
},
"pluginVersion": "12.1.1",
"targets": [
{
"datasource": {
"type": "influxdb",
"uid": "cexyp8mcclpfkd"
},
"query": "from(bucket: \"oraclius.bucket\")\n |> range(start: v.timeRangeStart, stop: v.timeRangeStop)\n |> filter(fn: (r) => r._measurement == \"ftp_transfers\")",
"refId": "A"
}
],
"title": "FTP TRANSFER",
"transformations": [
{
"id": "merge",
"options": {}
},
{
"id": "organize",
"options": {
"excludeByName": {
"Time": true,
"day": true,
"daynum": true,
"log_time": true,
"month": true,
"year": true
},
"includeByName": {},
"indexByName": {
"Time": 0,
"auth_method": 12,
"auth_method_extra": 13,
"bytes": 4,
"client_ip": 3,
"compression_method": 7,
"day": 15,
"daynum": 17,
"file_path": 5,
"ftp_date": 1,
"ftp_user": 10,
"log_time": 18,
"month": 16,
"service_name": 11,
"status": 14,
"transfer_direction": 8,
"transfer_number": 2,
"transfer_type": 6,
"user_type": 9,
"year": 19
},
"orderByMode": "manual",
"renameByName": {
"Time": "",
"auth_method": "AUTH METHOD",
"auth_method_extra": "AUTH METHOD EXTRA",
"bytes": "FILE SIZE",
"client_ip": "CLIENT IP",
"compression_method": "COMPRESSION METHOD",
"daynum": "",
"file_path": "FTP PATH",
"ftp_date": "FTP DATE",
"ftp_user": "FTP USER",
"service_name": "SERVICE NAME",
"status": "STATUS",
"transfer_direction": "TRANSFER DIRECTORY",
"transfer_number": "FTP TIME",
"transfer_type": "TRANSFER TYPE",
"user_type": "USER TYPE"
}
}
},
{
"id": "convertFieldType",
"options": {
"conversions": [
{
"destinationType": "number",
"targetField": "FTP TIME"
},
{
"destinationType": "number",
"targetField": "FILE SIZE"
},
{
"dateFormat": "DD/MM/YYYY HH:mm:ss",
"destinationType": "time",
"targetField": "FTP DATE"
}
],
"fields": {}
}
},
{
"id": "sortBy",
"options": {
"fields": {},
"sort": [
{
"desc": true,
"field": "FTP DATE"
}
]
}
}
],
"type": "table"
}
],
"preload": false,
"schemaVersion": 41,
"tags": [],
"templating": {
"list": []
},
"time": {
"from": "now-30m",
"to": "now"
},
"timepicker": {},
"timezone": "",
"title": "FTP Transfers Dashboard",
"uid": "1",
"version": 4
}7.) Testing the System with Test Data
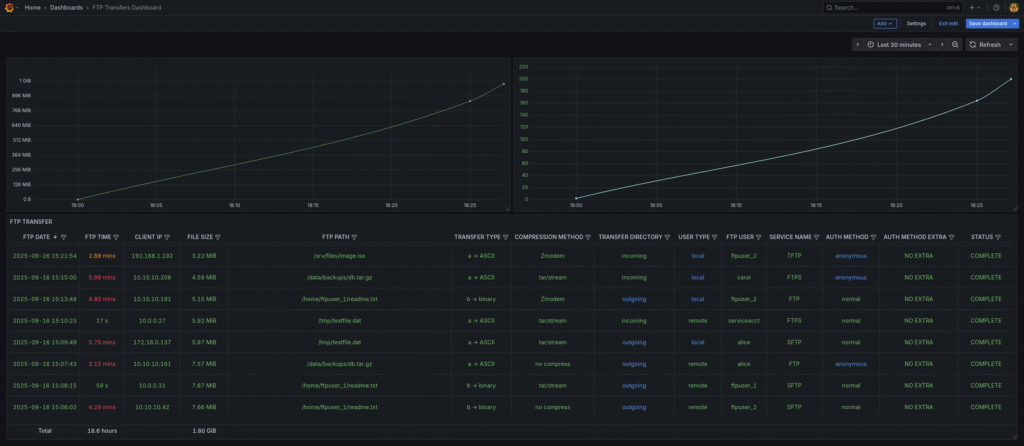
In this step, we will check our system by creating fake ftp records with a bash script and creating records in the xferlog file:
#!/usr/bin/env bash
# fake_xferlog_generator.sh
# Kullanım örneği:
#   ./fake_xferlog_generator.sh               # varsayılan: rate=100/min, output=/var/log/xferlog, sonsuz
#   ./fake_xferlog_generator.sh 200 /tmp/xferlog 600 0.9  # 200/min, /tmp/xferlog, 600 kayıt sonra dur, başarı oranı 90%

RATE_PER_MIN=${1:-100}           # kayıt/dakika
OUTFILE=${2:-/var/log/xferlog}   # hedef dosya (yazma izinlerini kontrol et)
MAX_COUNT=${3:-0}                # 0 => sonsuz, >0 => o kadar kayıt sonra çık
SUCCESS_RATIO=${4:-0.85}         # başarı yüzdesi (0..1)
MAX_BYTES=${5:-10485760}         # maksimum byte (default 10 MiB)

INTERVAL=$(awk -v r="$RATE_PER_MIN" 'BEGIN{printf "%.6f", 60.0/r}')
echo "RATE_PER_MIN=$RATE_PER_MIN, INTERVAL=$INTERVAL s, OUTFILE=$OUTFILE, MAX_COUNT=$MAX_COUNT, SUCCESS_RATIO=$SUCCESS_RATIO, MAX_BYTES=$MAX_BYTES"

# Örnek havuzlar — istersen burayı genişlet/ değiştir
USERS=(alice bob carol dave ftpuser_1 ftpuser_2 serviceacct)
FILES=("/home/ftpuser_1/readme.txt" "/home/ftpuser_2/upload.bin" "/srv/files/image.iso" "/data/backups/db.tar.gz" "/home/ftpuser_3/test_hosts_1.txt" "/tmp/testfile.dat")
CLIENT_NETS=("10.10.10." "10.0.0." "192.168.1." "172.16.0.")
SERVICES=(ftp sftp ftps scp tftp)
TRANSFER_TYPES=(b a)             # binary / ascii
COMPRESSION_METHODS=(_ Z T)      # '_' = none, Z,T = some servers
TRANSFER_DIR=(i o)               # incoming (upload) / outgoing (download)
USER_TYPES=(r l)                 # remote / local
AUTH_METHODS=(0 1)               # 0=real user, 1=anonymous
STATUS=(c i)                     # complete / incomplete

# ensure outfile exists and is writable (try to create)
touch "$OUTFILE" 2>/dev/null || { echo "Hata: $OUTFILE dosyasına yazamıyorum. İzinleri kontrol et veya başka bir yol ver."; exit 1; }

# helper: random int [0,n-1]
rand() { echo $((RANDOM % $1)); }

# helper: random ip from prefix
rand_ip() {
  prefix=${CLIENT_NETS[$((RANDOM % ${#CLIENT_NETS[@]}))]}
  echo "${prefix}$((RANDOM % 254 + 1))"
}

# helper: random element
pick() { arr=("$@"); echo "${arr[$((RANDOM % ${#arr[@]}))]}"; }

# generate random timestamp within last N seconds (default 48h)
RANGE_SEC=$((48*3600))
rand_timestamp() {
  now=$(date +%s)
  offset=$((RANDOM % RANGE_SEC))
  t=$((now - offset))
  date -u -d "@$t" '+%a %b %d %T %Y' 2>/dev/null || date -d "@$t" '+%a %b %d %T %Y'
}

count=0
transfer_number=1

while true; do
  # stop condition
  if [ "$MAX_COUNT" -ne 0 ] && [ "$count" -ge "$MAX_COUNT" ]; then
    echo "Üretim tamamlandı: $count kayıt üretildi."
    exit 0
  fi

  # build random record
  ts=$(rand_timestamp)                    # "Sat Sep 13 06:31:18 2025"
  tn=$transfer_number
  cip=$(rand_ip)
  bytes=$(( (RANDOM * RANDOM) % (MAX_BYTES+1) )) # biraz dağılım için çarpılıyor
  file=$(printf "%s" "${FILES[$((RANDOM % ${#FILES[@]}))]}")
  ttype=${TRANSFER_TYPES[$((RANDOM % ${#TRANSFER_TYPES[@]}))]}
  comp=${COMPRESSION_METHODS[$((RANDOM % ${#COMPRESSION_METHODS[@]}))]}
  dir=${TRANSFER_DIR[$((RANDOM % ${#TRANSFER_DIR[@]}))]}
  utype=${USER_TYPES[$((RANDOM % ${#USER_TYPES[@]}))]}
  user=${USERS[$((RANDOM % ${#USERS[@]}))]}
  svc=${SERVICES[$((RANDOM % ${#SERVICES[@]}))]}
  auth=${AUTH_METHODS[$((RANDOM % ${#AUTH_METHODS[@]}))]}
  # auth_method_extra: ya '*' ya kısa token
  if (( RANDOM % 10 == 0 )); then
    am_extra="tok$(printf '%04d' $((RANDOM % 10000)))"
  else
    am_extra="*"
  fi
  # success or fail by ratio
  rprob=$(awk -v r="$RANDOM" 'BEGIN{printf "%.6f", r/32767}')
  if (( $(awk -v p="$rprob" -v s="$SUCCESS_RATIO" 'BEGIN{print (p < s)}') )); then
    stat="c"
  else
    stat="i"
  fi

  # Compose xferlog line (matches örnek format)
  # Format: "Sat Sep 13 06:31:18 2025 100 10.10.10.11 10 /path/to/file b _ i r ftpuser ftp 0 * c"
  line="$ts $tn $cip $bytes $file $ttype $comp $dir $utype $user $svc $auth $am_extra $stat"

  # Append to file (atomic append)
  printf "%s\n" "$line" >> "$OUTFILE"

  # increment counters
  transfer_number=$((transfer_number + 1))
  count=$((count + 1))

  # sleep interval
  sleep "$INTERVAL"
done
Let's check the Telegram log for possible errors:
# telegraf --config /etc/telegraf/telegraf.conf --debug
...
2025-09-16T15:24:06Z D! [outputs.influxdb_v2] Wrote batch of 16 metrics in 2.644223ms
2025-09-16T15:24:06Z D! [outputs.influxdb_v2] Buffer fullness: 0 / 10000 metrics
2025-09-16T15:24:16Z D! [outputs.influxdb_v2] Wrote batch of 16 metrics in 2.692254ms
2025-09-16T15:24:16Z D! [outputs.influxdb_v2] Buffer fullness: 0 / 10000 metrics
2025-09-16T15:24:26Z D! [outputs.influxdb_v2] Wrote batch of 16 metrics in 3.535188ms
2025-09-16T15:24:26Z D! [outputs.influxdb_v2] Buffer fullness: 0 / 10000 metrics
2025-09-16T15:24:36Z D! [outputs.influxdb_v2] Wrote batch of 17 metrics in 3.50399ms
2025-09-16T15:24:36Z D! [outputs.influxdb_v2] Buffer fullness: 0 / 10000 metrics
...
It captures incoming ftp transfers at a certain interval very well.


Leave a Reply to %s